It is so obvious that it belongs to our daily life. Satisfaction is a simple mathematical ratio between our expectations in comparison with our experience.
This ratio is not exclusively linked to our «will», but it is based on several elements that compose our customer’s life, the experience both with our competitors and in general the «customer care» concept. A customer is «one-no one-one hundred thousand»; our ability is to know and understand him/her, identify his/her needs in order to steer marketing actions to the purposes he/she is in search of.
Methodology
Generally,
what is satisfaction?It is a very simple mathematical ratio.
01How can we do marketing if we do not know our customer?
That is why facing new challenges for the fair system means to study our customers, experience the Customer Satisfaction as the basis to do Business Intelligence, build the «Buyer Personas» on which to place marketing actions.
It means implementing a Customer Care based on the real customer’s needs, feeding the promotors systems generated inside a vertical event, listening with the logic of those who want to learn and opening new interaction channels with customers.
ExpoIntelligence Score:The Score for the fair system
02The Expo Intelligence Score is our technique to measure uniformly the level of the customers satisfaction; this method measures the “word-of-mouth advertising rate” and takes a reliable indicator, anticipating the growth rate of the fair, and consequently of its success.
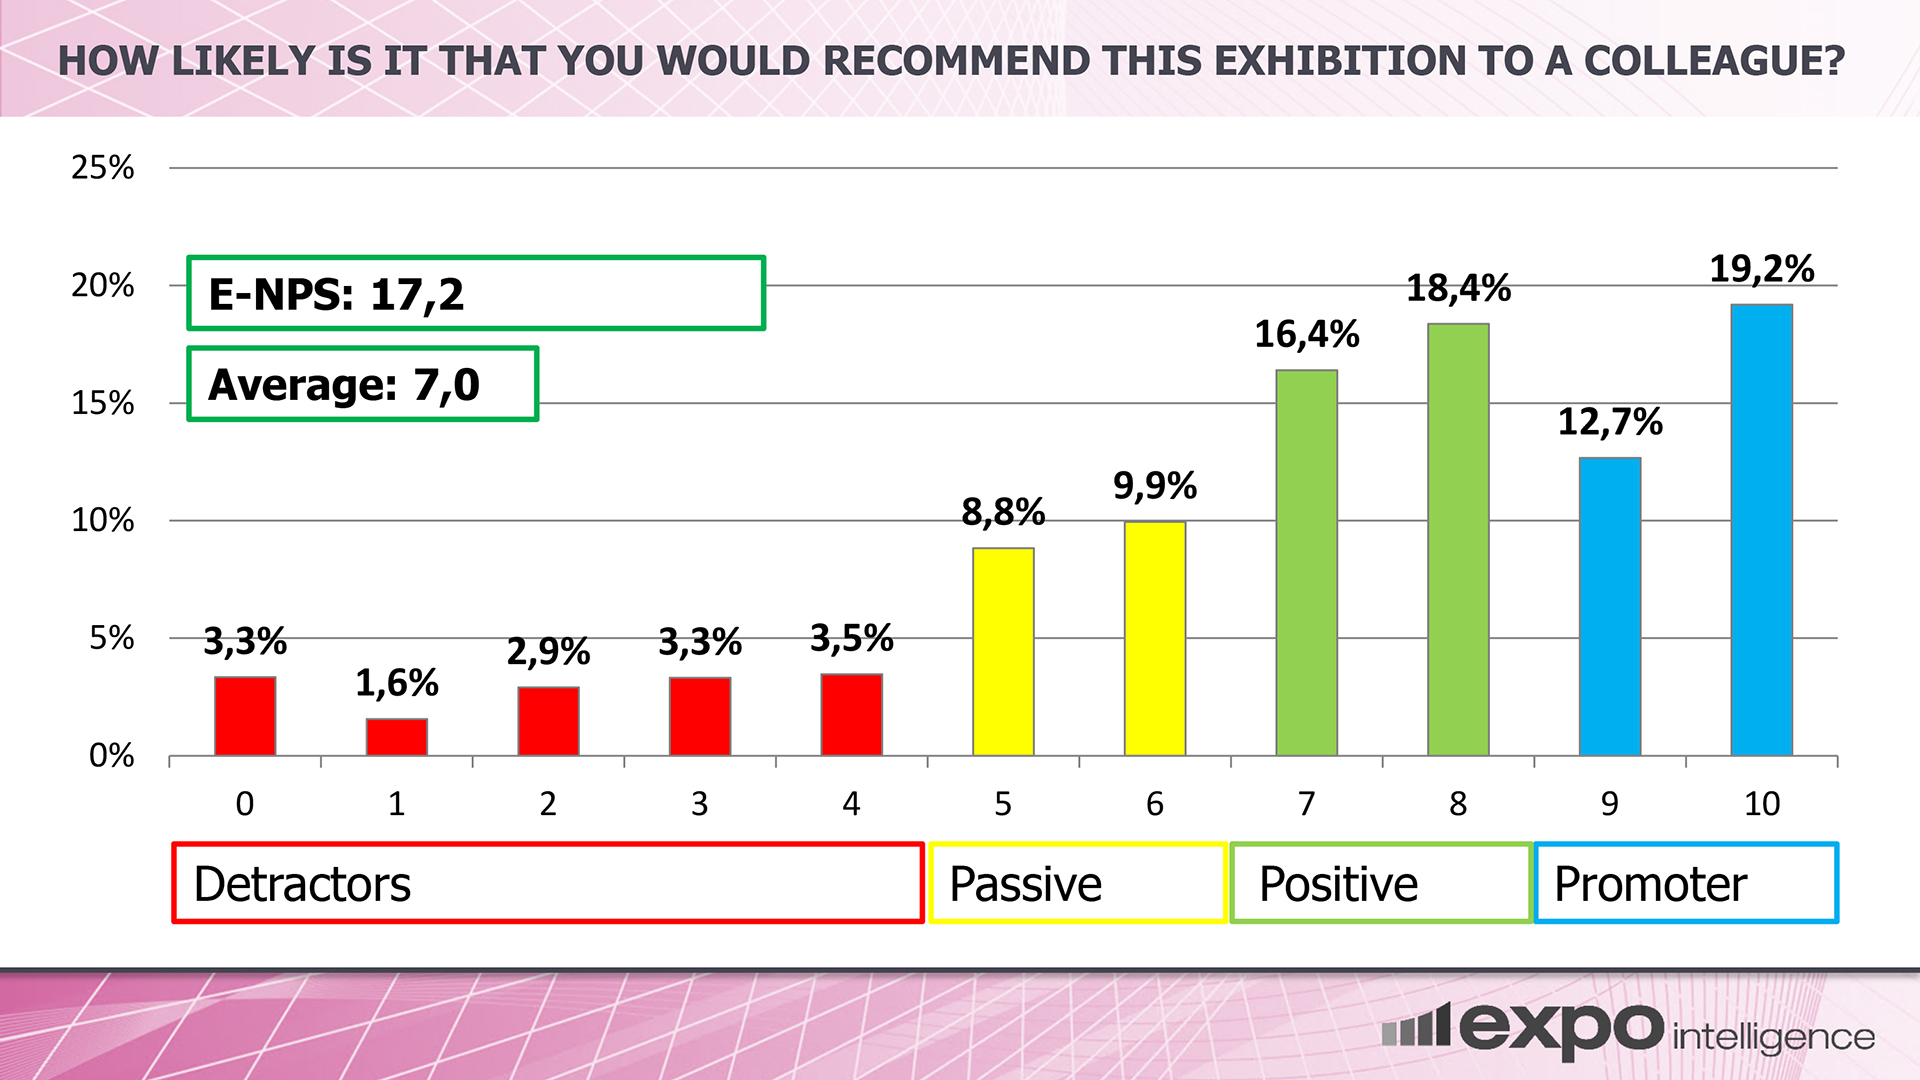
The indicator is built starting from the evaluation given by the following question:
On a scale from 0 to 10, how much would you recommend this product to a friend, colleague of yours, or other people?
(Where 0 means “not so likely” and 10 means “extremely likely”)
ExpoIntelligence long experience in the fair world has led to a new index called EIS having the same features than NPS ®, but given the peculiarity of the fair industry that does not consider the use of a product, but the partecipation in an event, it recodifies the index structure as follows:
Denigrators
0
Passive customers
Positive customers
Supporters
10
Where the codification is composed as follows:
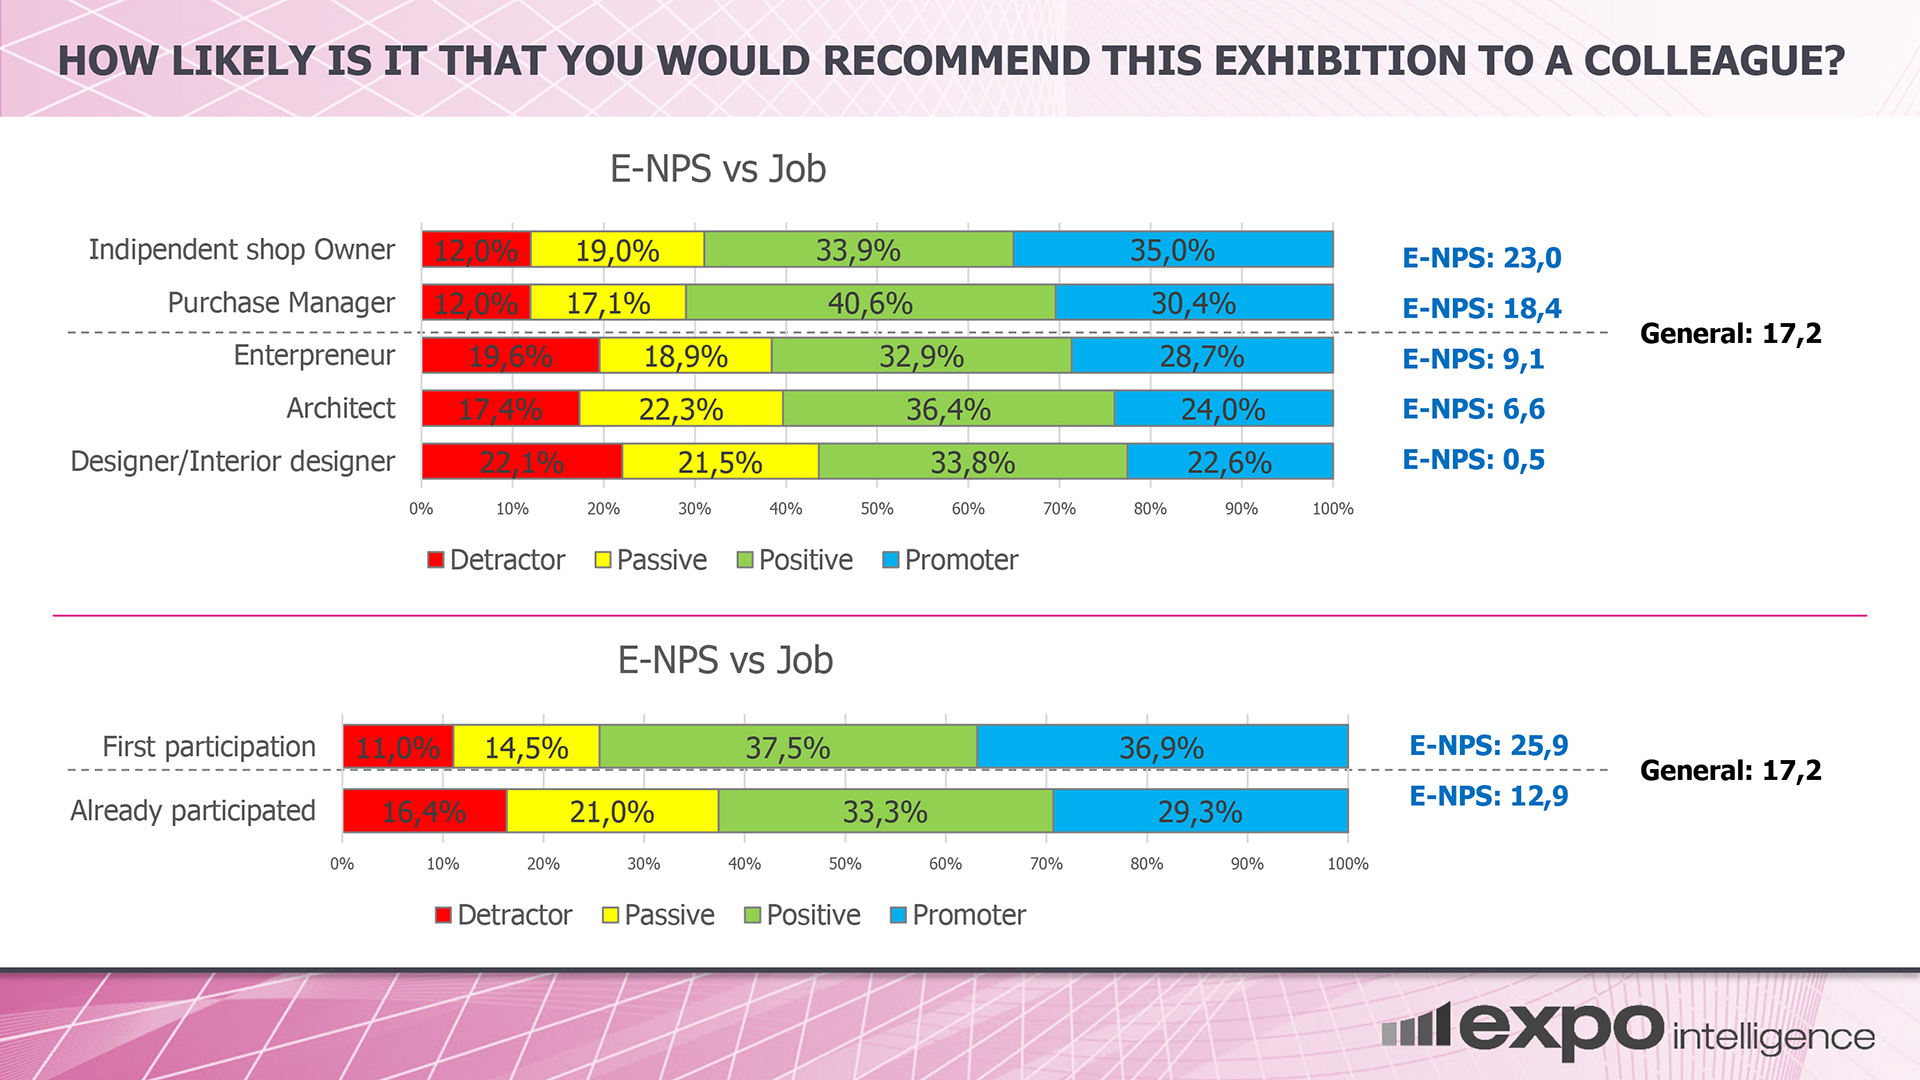
What is coming out is a deepest analysis of the elements related to each identified tipology, as shown below:
This analysis tipology allows to identify, for specific “clusters”, even the involvement dynamics of specific customer’s tipologies, or according to one’s experience in terms of participation in the fair for the first time: